Wednesday, June 3, 2026

Seeding Tomorrow's Tax Base: The Formalisation Argument the Finance Commission Hasn't Made Yet

Direct tax collection in India is heavily concentrated: a small number of states account for a large share of receipts, while many others contribute far less than their population or economic size would suggest. This concentration is often read along regional lines. That reading is incomplete. The underlying driver is not geography but the degree to which a state's economy is formalized and digitized - how much of its economic activity runs through salaried employment, registered enterprises, and traceable digital transactions rather than cash and informal arrangements. This piece sets out that pattern using data for FY 2024-25 and the preceding years, and considers what it implies for the 16th Finance Commission as it designs devolution and equalisation mechanisms.

The fiscal anomaly

The data show that five states - Maharashtra, Karnataka, Delhi, Tamil Nadu, and Gujarat - together contributed 76% of total direct tax collections in FY 2024-25, while accounting for only around 27% of the country's population.

In other words, roughly one-fourth of the population contributes three-fourths of direct tax revenue.

Figure 1 & 2: "27% of people, 76% of tax"


(Click on the image to zoom)

A services-digitalisation corridor

India's direct tax map is best read not as a map of population, but as a map of formalisation and digitalisation. The same five states that generate over three-quarters of corporate and personal income tax collections house little more than a quarter of the population.

What these states share is not size but infrastructure for the formal economy: a concentration of salaried employment in organised sectors, large corporate head offices, filings related to ESOP income and capital gains on listed securities, a deep gig and platform economy, and high levels of digital adoption.

This can be described as a "services-digitalisation corridor" - a set of economic geographies, running broadly from Ahmedabad through Mumbai to Delhi and Bengaluru and on to Chennai, where the formal wage economy is densest, digital payment penetration is highest, and the gap between GDP and taxable economic activity is smallest.

Figure 3: Tax collection intensity (Tax collected, FY 2024-25 / total population, 2011 Census)


(Click on the image to zoom)

States such as Uttar Pradesh and Bihar together hold a little over a quarter of India's population but contribute less than 3% to the direct tax corpus. This is not primarily a function of lower income levels; it reflects the structure of the economy - a larger share of income arising from agriculture, trading, and small-scale business that sits outside self-assessment regimes by design, not by choice.

The policy message that follows is straightforward: expanding the direct tax base is less a question of rates or enforcement and more a question of formalisation.

Figure 4: Ratio of tax collection to GSDP


(Click on the image to zoom)

Each additional job created in the organised sector, each small trading firm that adopts GST-compliant invoicing, each contractor who moves onto the books, is a taxpayer at the edge of formalisation. The base widens as formalisation spreads.

Direct tax collection tracks formalisation and digital visibility rather than population or GDP alone. The tax map is, in effect, a map of where the formal services economy is concentrated.

Formalisation trajectories: fast movers and slower starters

Looking at the compound annual growth rate (CAGR) of direct tax collections for FY19–FY25 shows that formalisation is not fixed to any one place - it can spread over time.

Telangana recorded a 44% CAGR in direct tax collections over this period - evidence of its emergence as a technology and pharmaceutical hub, marked by large campuses, salaried workforces, and listed companies.

Haryana's 18% CAGR reflects a related pattern: Gurugram's concentration of corporate registered offices and high-salary employment is now visible in the tax data. Together, these two states illustrate that formalisation can extend beyond its original centres, and that direct tax growth tends to follow closely behind.

By contrast, Bihar, Assam, Madhya Pradesh, Uttarakhand, and Andhra Pradesh recorded CAGRs at or below zero over the same period - meaning their direct tax base is not just small in absolute terms but static or shrinking.

Figure 5: CAGR of direct taxes, FY 2019–25


(Click on the image to zoom)

This pattern is not simply a proxy for state income levels - some of these states have recorded reasonable GSDP growth over the same period. The more fundamental issue is that growth in these states is often concentrated in agriculture, informal construction activity, small-scale retail, and subsistence services - sectors that sit largely outside the reach of income tax administration as currently structured.

The distinction that matters for tax policy is not which state is growing, but whether that growth is occurring within organised, documented economic activity or within a large informal sector that remains outside the income tax net.

Concentration over time: the Lorenz curve

A single summary statistic captures a broader shift: the Gini index for direct tax concentration across states rose from 0.6342 in FY19 to 0.6506 in FY25.

Direct tax collection has become more concentrated over the past six years. The FY25 curve sits further from the line of equality than the FY19 curve, meaning that the lower 60–70% of states (by tax contribution) now account for a smaller share of the total than they did six years earlier, while the highest-contributing cluster has pulled further ahead.

It is worth being precise about what this concentration represents: it is not primarily a story of already-wealthy states becoming wealthier in income terms. It is better understood as growing divergence between formal and informal segments of state economies.

The practical implication for policy: the current trajectory does not, by itself, widen the geographic base of direct taxation.

Compliance mechanisms operating within the corridor -  an expanded TDS regime, capital-gains reporting, the Annual Information Statement, and related measures - are working efficiently wherever formal incomes already exist. None of these instruments, by design, reach into informal economic activity in places such as Bihar, eastern Uttar Pradesh, or rural Madhya Pradesh, where the underlying gap widens each year that growth occurs without accompanying formalisation.

Figure 6: Lorenz curve of direct tax distribution, FY19 vs FY25


(Click on the image to zoom)

Four fiscal archetypes

A fiscal-digital alignment chart - plotting a digitalisation index against the tax-to-GSDP ratio - is arguably the most policy-actionable view in this analysis, because it moves past "why is there a gap" to "what can be done about it." The answer differs across four broad clusters.

States in the high-digitalisation, high-tax-yield quadrant have already become mature fiscal hubs. For these, the priority is not to push further but to institutionalise: build compliance infrastructure and reduce leakage in treaty benefits and capital gains reporting. One large state sits just below this group -  highly digitised, but with some extraction headroom still available.

A second, emerging-formalisation cluster - including Telangana, Haryana, and Kerala -  has reached meaningful levels of digitalisation but has not yet converted this fully into tax yield, suggesting the gains are still working their way through the system.

A third cluster - an "industrial middle" that includes Gujarat, Tamil Nadu, and Andhra Pradesh - shows moderate-to-high digitalisation alongside comparatively low tax-to-GSDP ratios, consistent with a large presence of proprietorship firms and trading enterprises where digital payments are common but account-level transparency is limited.

A fourth, catch-up cluster - including Uttar Pradesh, Bihar, Rajasthan, Madhya Pradesh, Odisha, and the north-eastern states - shows low levels on both dimensions. For this group, incremental compliance measures or nudges are unlikely to move the needle, because the underlying preconditions for direct taxation - organised employment and registered enterprise - are not yet present at scale.

Figure 7: Digitalisation index vs tax-to-GSDP ratio


(Source: Digitalisation Index data from the State of India's Digital Economy Report 2024)

(Click on the image to zoom)

The chart's implicit message for the Finance Commission is that equalisation and devolution design should account for tax administration capacity, not effort alone. Expecting any state to match the tax-to-GSDP ratio of a mature fiscal hub without first closing the formalisation gap sets an unrealistic benchmark.

India's direct tax geography remains in motion, and decisions made over the next five years will shape whether that motion moves toward convergence or further concentration.

The devolution paradox

The Finance Commission's horizontal devolution formula is designed specifically to offset this kind of imbalance: states that collect more, and are more fiscally efficient, receive proportionally less in devolved funds, while less prosperous states receive more. There is nothing wrong with this design in principle. The difficulty is that the gap it is meant to bridge is widening faster than transfers alone can close it - because transfers address fiscal need, not fiscal capacity. Additional allocations do not, by themselves, make an economy more taxable.

The missing instrument

The gap is not primarily a case for more redistribution. It calls for investment - distinct from redistribution - in the preconditions without which direct taxes cannot be levied in the first place.

This includes expanding digital payments infrastructure in tier-3 cities, supporting GST compliance for micro-enterprises, and helping proprietorships and MSMEs formalise.

These are not welfare measures; they are supply-side fiscal investments that expand the tax base over a ten-year horizon and, over time, ease the burden currently concentrated on a small number of states. Every small enterprise that moves from a cash-based to a formal footing - wherever it is located - is a taxpayer in the making.

The Commission could usefully frame formalisation not as a development outlay, but as fiscal infrastructure.

An equation for where India is heading

The 16th Finance Commission inherits a direct tax geography that is more concentrated, and more unevenly digitised, than that faced by any of its predecessors. It also has access to a richer body of state-level data than before - on formalisation, UPI transaction volumes, GST compliance rates, and AIS-based income information - that can inform a devolution design aimed at expanding the future tax base, not only redistributing the present one. States on the cusp of formalisation do not need special dispensation; they need the enabling conditions to complete that transition.

A formula for the decade ahead

India's direct tax landscape in 2035 will be shaped by decisions taken now. A commission that looks only at the past can build a formula based on the past; a commission that looks ahead can build a formula for the decade to come. The 16th Finance Commission has the opportunity to do both.


Disclaimer: The views expressed herein are solely those of the author in a personal capacity and do not represent the official views or position of the author's organisation.

Wednesday, February 4, 2026

Who Writes the World’s Tax Rules and Who Pays the Price?

Global tax rules shape how countries raise money to fund health care, education, infrastructure, and social welfare. Yet for many developing countries, including India, these rules are not delivering fair outcomes. Despite decades of international tax reforms led by the OECD, profit shifting, tax avoidance, and offshore wealth continue to grow. The result is a steady loss of public revenue in countries that can least afford it.

This gap between global promises and real outcomes has revived an important debate: whether global tax governance should move from an OECD-led system to a more inclusive, United Nations–led framework.

How Profits Are Shifted Away From Where Value Is Created

Multinational companies operate across borders, but tax systems remain largely national. This mismatch allows firms to shift profits to low-tax jurisdictions even when real business activity takes place elsewhere. This practice, known as Base Erosion and Profit Shifting (BEPS), directly reduces the tax base of developing countries.

According to OECD, 36% of multinational profits are shifted to tax havens every year. For developing countries, the revenue loss is estimated at about 1.3% of GDP annually, which is higher than the loss faced by developed countries. Because poorer countries depend more on corporate tax revenue and have fewer alternative sources, these losses have a much stronger impact on their ability to provide basic public services.

The Global “Race to the Bottom” in Corporate Taxes

Over time, countries have responded to mobile capital by lowering corporate tax rates to remain competitive. This has led to a global “race to the bottom”, where tax rates fall but investment and revenue do not necessarily rise.

[Figure 1: Trends in Corporate Tax Rates by Region, 1980–2024]


Source: Enache, C. (2025) 

The data presented above shows a steady decline in corporate tax rates across regions from 1980 to 2024. India follows this trend closely. Corporate and capital tax rates in India fell sharply after 2019, reflecting competitive pressures rather than domestic revenue needs.

[Figure 2: Corporate and Capital Tax Rate Trends in India, 1965–2021]

                                  
                                             Source: The Atlas of the Offshore World. n.d.-b 

While lower tax rates are often justified as growth-friendly, the evidence shows that they mainly benefit large multinational firms. Governments are then forced to rely more on indirect taxes such as GST, which places a heavier burden on ordinary citizens and widens inequality.

Offshore Wealth: The Biggest Blind Spot in Global Tax Rules

Even after global transparency measures such as the Common Reporting Standard (CRS), offshore wealth has continued to grow. According to the Global Tax Evasion Report 2024, global households held around $12 trillion in offshore financial assets in 2020, equivalent to more than 14% of global GDP.

[Figure 3: Global Household Offshore Financial Wealth, 2001–2022]


Source: Global Tax Evasion Report 2024

Despite the automatic exchange of information, nearly 30% of offshore wealth remains unreported. One major weakness of the current system is that it does not adequately cover offshore real estate.

This gap is clearly visible in the case of Dubai.

[Figure 4: Who Owns Real Estate in Dubai (2020)]


                                          Source: The Atlas of the Offshore World. n.d.-b 

Indians owned $29.8 billion worth of real estate in Dubai in 2020, making them the largest foreign holders. Much of this property is owned through shell companies or trusts, which makes it difficult for tax authorities to identify the real owners. These assets often escape domestic taxation altogether.

India’s Reality: High Participation, Limited Results

India has actively participated in OECD-led reforms. It joined the BEPS Inclusive Framework in 2016, implemented country-by-country reporting, adopted the Common Reporting Standard, and supported global minimum tax discussions. Yet the results on the ground remain weak.

[Figure 5: Corporate Tax Revenue Lost in India Due to Profit Shifting]


                                         Source: The Atlas of the Offshore World. n.d.-b 

The data shows that India lost more than $12 billion in corporate tax revenue in 2021 due to profit shifting, mainly to non-EU tax havens. Overall annual losses from tax evasion and avoidance exceed $31 billion.

At the same time, offshore financial wealth held by Indian households has continued to rise, especially after 2015.

[Figure 6: Offshore Financial Wealth Held by Indian Households]


                                           Source: The Atlas of the Offshore World. n.d.-b 

These trends show that participation in global frameworks alone is not enough when enforcement is weak and rule-making power remains unequal.

A Corporate Example: How Profit Shifting Works in Practice

The case of H illustrates how profit shifting operates within legal boundaries. H pays royalties to its parent company located in Europe for the use of brands and technology. Over time, these royalty payments have increased steadily.

[Figure 7: H Turnover vs Royalty Payments Over Time]


                                                  Source: Books of Accounts of H

Royalty payments rose faster than turnover, and royalty as a percentage of revenue increased consistently after 2013. Even during periods of modest business growth, payments continued to rise. Such arrangements reduce taxable profits in India while shifting income to low-tax jurisdictions.

This case highlights the limits of both OECD rules and domestic transfer pricing laws when it comes to valuing intangible assets like brands and intellectual property.

Why OECD-Led Tax Governance Falls Short

Although the OECD has played a central role in global tax reform, the system suffers from structural weaknesses. Decision-making power remains concentrated among richer countries, while developing countries often play only a consultative role. Compliance rules are complex and costly, and enforcement relies heavily on voluntary cooperation.

Recent global minimum tax reforms further reveal this imbalance. Estimates show that G7 countries, representing about 10% of the world’s population, are likely to receive around 60% of the additional tax revenue generated by these reforms(McCarthy, 2022). This raises serious questions about fairness and legitimacy.

Why a UN-Led Tax Framework Offers Hope

A United Nations–led global tax framework offers a more inclusive alternative. Unlike the OECD system, the UN operates on a one-country-one-vote principle, giving developing countries an equal voice in rule-making.

A UN Tax Convention could allow multinational companies to be taxed on their global consolidated profits, with taxing rights allocated more fairly based on real economic activity. It could also strengthen transparency, especially in areas like offshore real estate and beneficial ownership.

For India, this shift matters. The country loses revenue equivalent to multiple times its annual public health budget due to tax avoidance and profit shifting. A more inclusive global system could help recover this lost fiscal space.

The Way Forward

Moving global tax governance to the UN will not be easy. Rich countries may resist changes that redistribute taxing rights. Capacity gaps across countries remain large. Enforcement will be challenging.

Yet the current system has clearly failed to protect the interests of developing economies. Global tax rules are no longer just technical instruments; they shape inequality, development, and state capacity.

If global tax cooperation is to be fair and effective, it must be inclusive. A UN-led approach offers the most credible path toward a system that works not just for rich countries, but for countries like India as well.

                                                                     ************

Disclaimer: The views expressed herein are solely those of the author in a personal capacity and do not represent the official views or position

Saturday, June 28, 2025

Taxation and Mobility: A Cross-Time Analysis of India’s Experience

Taxation and Mobility: A Cross-Time Analysis of India’s Experience

This article explores tax-related migration from ancient India to modern time. Tax migration refers to the effects of taxation on the geographic mobility of people. There is a rich history in ancient India of kings providing tax exemptions to encourage  highly skilled artisans, poets, astrologers, and scholars to migrate and settle to promote learning, elevate cultural and religious life, and improve societal well-being in their country. Tax-free agraharas were granted to Brahmins to settle and teach in new regions, as recorded in Chola copperplate inscriptions. The Arthashastra recommends land and tax holidays to attract skilled migrants and develop frontier areas. Buddhist Sanghas were gifted entire villages free from state levies to support monastic life. Even the legend of Agastya’s southern migration reflects such royal patronage through land grants and privileges. Thus, the tax exemptions acted as a key element to encourage migration and settlement since ancient times. Does this phenomenon continue even today? Let us examine.

The research establishes the fact that tax-related migration is very common among distinguished personalities who are in the fields of invention, sports, and acting even today. What fuels this trend? Of course, there could be mutual benefits for both state and tax-migrants. It is reported that actor Akshay Kumar has obtained Non-Resident Indian (NRI) status primarily for tax purposes, allowing his global professional income to remain outside the Indian tax net. This strategy is not uncommon among high-profile individuals—such as celebrities, sportspersons, and tech entrepreneurs—who often earn substantial cross-border incomes. Among various motivations, one key reason individuals opt for Non-Resident or Non-Domiciled (Non-Dom) status is to minimize their tax burden by relocating their tax residency to countries that offer low or zero personal income tax regimes.(NRI - refers to persons who stayed abroad for more than 182 days in a year)

Further, studies found that the High-Net-Worth- Individuals(HNWI) are highly -elastic to the tax rates and readily mobile to change their resident status to save them from paying large taxes. India has increasingly witnessed this trend. Migrating the wealth to offshore havens in response to high-tax-rates is a long- existing trend. As we see several tax havens offer mechanisms to conceal wealth in their countries in the form of equities, real assets, financial instruments etc. (HNWI- refers to persons who have ₹5 crore and above in investible assets as per SEBI)

The HSBC, Panama, Paradise, Pandora, and Dubai leaks together show a clear pattern of Indians hiding wealth offshore. The HSBC Swiss leaks (2015) alone revealed over 1,000 Indian account holders with undeclared assets worth more than $4.1 billion. The Panama Papers (2016) and Paradise Papers (2017) exposed secret offshore companies linked to politicians, actors, and business groups. However, there is a worrying trend of exodus of HNWI to foreign destinations. What exactly inspires this trend?

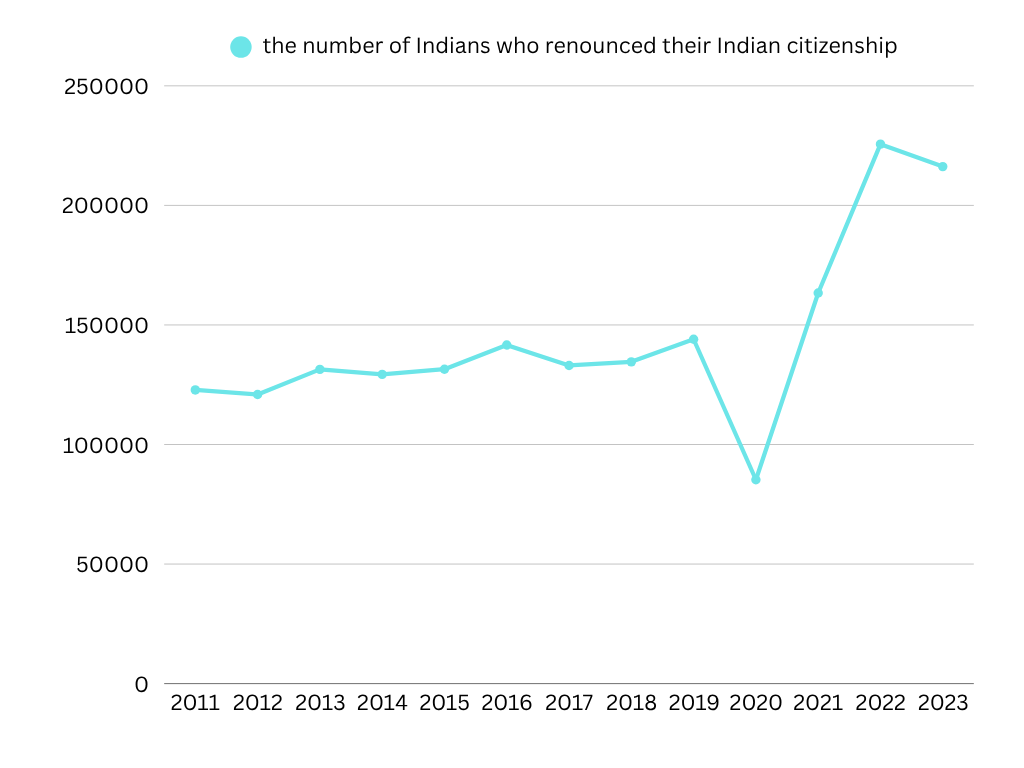
The trend analysis reveals that from 2011 to 2019, the number of people renouncing Indian citizenship remained relatively stable, ranging between 1,20,000 and 1,45,000 annually. A sharp dip occurred in 2020, with the number falling to around 85,000—likely due to COVID-19-related travel restrictions and global uncertainty. This was followed by a dramatic rise, 2021: 1,60,000, 2022: Peak at 2,25,000 (highest in the period), 2023: Slight decline to 2,15,000, but still historically high. As per the Ministry of External Affairs(MEA), reasons for renouncing citizenship  are personal. Also, MEA acknowledges the potential of the global workplace in an era of a knowledge economy.

Trends in the Indians who renounced citizenship:


There could be several pull factors and push factors to this structural shift in rise in number. The push factors could be deteriorating quality of life, lack of job opportunities, lack of recognition of talent, high taxation rates( both direct and indirect). The pull factors include zero or low tax rates, better job-cum-remuneration, quality of life, career prospects, better social security etc. However, we lack data to ascertain what exactly drove them to renounce Indian citizenship. 


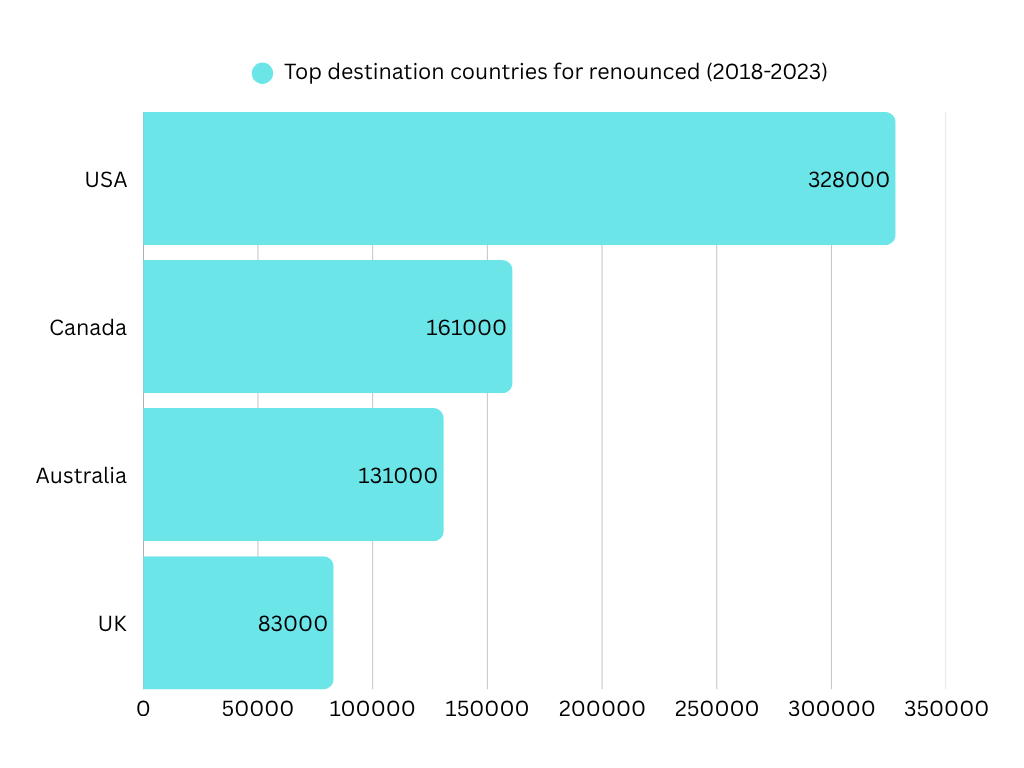
Despite the lack of direct evidence, the countries wherein these people took citizenship offers some insights about the motives. USA, Canada, and Australia accounting for the choices of more than 75% of the renounced. These patterns underscore that Indian emigrants prioritize countries with transparent immigration systems, better social infrastructure, stronger passports, and favorable work or business conditions. The dominance of the U.S. also reflects the continued demand for high-skilled Indian workers, especially in tech and healthcare sectors. 


Top destination countries for renounced from India:


From the above analysis, safely, we can conclude that this trend of renouncements  to anglophonic countries as “career oriented mobility” rather than tax-based-migration, as these countries do not offer any preferential taxation regime for immigrants and also tax rates are relatively high. 


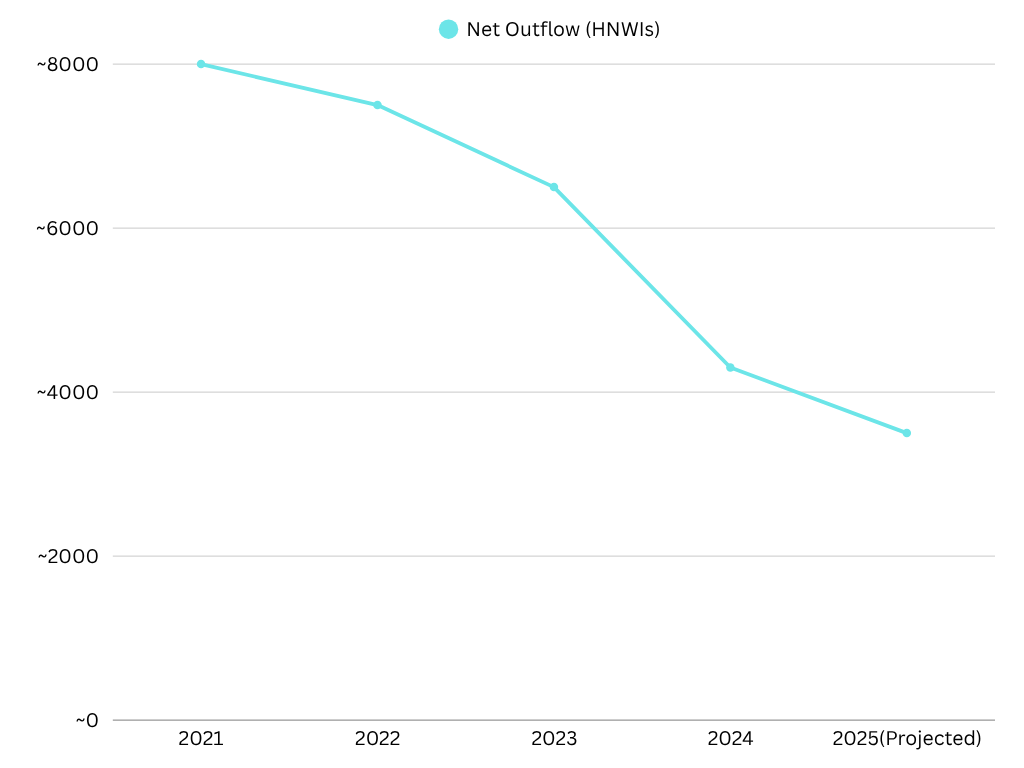
On the other hand, there was a persistent trend of exodus of HNWI in the recent past. As per the Henley & Partners Private Wealth Migration Reports (2022–2025), India is one of the top countries where exodus of HNWI persists. The figure below captures the trend of HNWI exodus from 2021 to 2025(projected). The report points to the fact that most of the HNWI emigration happens to UAE. Although the trend is not so alarming, it reveals the socio-economic preferences of the HNWI in choosing UAE, US and Singapore. Taxation is one of the major reasons driving this trend. The major reasons include UAE offers Zero personal income tax and other favourable disclosure norms. On the contrary, India tightened the disclosure norms on the global incomes of the tax residents with the Black Money Act etc. 


Trends in exodus of High Net Worth Individuals from India:


According to Henley & Partners, India continues to lose large numbers of millionaires, especially to the UAE. However, in our view these outflows are not particularly concerning as India continues to produce far more new HNWIs than it loses to emigration. Furthermore, the bulk of the millionaires who leave India tend to retain business interests and second homes in the country, which is a positive sign. Though re-assuring, we cannot be complacent with the trend. Exodus of HNWI means not only loss of tax revenue, also, impact on growth of private jobs, innovation, investor confidence, business sentiment etc. India must take necessary steps to reverse this trend at the earliest. 


Comparative chart of tax rates of relevant countries:


Country

Top Personal Income Tax Rate

Capital Gains Tax

Inheritance Tax

Remarks

India

30% + surcharge (up to ~43%)

10–20% depending on asset & period

None

High effective tax rate for HNWIs; no inheritance tax; compliance tightening in recent years.

UAE

0%

0%

0%

Tax haven; no personal income tax or capital taxes; popular among HNWIs for asset protection.

USA

37% (federal) + state taxes

Up to 20% + possible state taxes

Yes

High total tax burden; offers business and lifestyle opportunities; estate taxes significant.

Canada

33% (federal) + provincial

50% of capital gain is taxable

None (but probate fees)

Progressive system; high rates at upper incomes; strong public services attract emigrants.

Australia

45%

Taxed as income; 50% discount after 1 year

None

High income tax; CGT can be optimized; no inheritance tax; strong social benefits.

UK

45%

10–20% based on income & asset type

Yes (40% above threshold)

High taxes; inheritance tax burdened; Non-Dom regime historically favored wealthy foreigners.

Singapore

22%

No capital gains tax

No

Low-tax hub; no CGT or estate tax; efficient compliance; very HNWI-friendly environment.


In ancient India, kings attracted talent across disciplines by offering land grants and tax-exempt revenue villages, thereby enriching societal and economic life. Drawing inspiration from this historical approach, modern India must focus on rationalizing its tax regime and simplifying compliance to retain high-net-worth individuals. Providing targeted incentives for returning NRIs and fostering investor confidence are equally important. At the same time, enforcement against offshore tax evasion should be balanced with the need to support global mobility. Broader reforms aimed at improving ease of living and doing business will be essential for sustaining long-term economic retention.

Retaining talent today requires the wisdom of ancient incentives with the agility of modern reform


Tuesday, June 24, 2025

Behavioural Nudges in Tax Compliance


India's tax compliance remains notably low, with a tax-to-GDP ratio below 12%, significantly trailing behind OECD nations. In the realm of Direct Taxation, this ratio hovers around 5%, which is insufficient and inadequate. The accompanying chart illustrates the disparity between the Direct tax-to-GDP rate and the GDP Growth rate, highlighting the widening gap between the two. This suggests that a substantial portion of the population is outside the tax net and not contributing to the nation despite the evident economic growth. 
Figure: 1 Direct tax to GDP rate Vs GDP Growth Rate  Figure: 2 Year-wise Number of Filers  and Percentage Change

The relationship between economic growth and tax collection is mutually reinforcing. Over the past 30 years, India has experienced consistent and organic growth in its gross domestic product. However, direct tax collection does not accurately reflect this GDP growth. The tax-to-GDP growth rate has remained largely flat, indicating a lack of buoyancy in collection over the years. While many attribute this lack of buoyancy to skewed income distribution, it is evident that the country must also tackle compliance gaps.

The World Bank suggests that an ideal tax-to-GDP ratio is approximately 15%. This ratio plays a crucial role in fostering economic growth and development, facilitating a country's transition from low-income to middle-income status. It enhances the government's capacity to invest in essential public services such as education and healthcare. Additionally, a robust tax-to-GDP ratio helps mitigate economic volatility and address income inequality, allowing countries to avoid reliance on borrowed funds for development initiatives(Taxing for Growth: Revisiting the 15 Percent Threshold, 2024). 

India has significantly under-invested in critical areas like health, education, skill training, and infrastructure. This raises serious doubts about the State’s ability to generate resources through effective taxation. India still has 30% of its people living in poverty. 

Figure: 3 India’s Public Investment in Key Nation-Building Sectors(% of GDP)

It is inevitable for the country to mop up the resources through the right taxation of the right people. Traditional enforcement models, which rely on search and seizure operations (often referred to as raids), audits, and hefty penalties, fail to address the behavioral factors that drive tax compliance. There is a pressing need to integrate behavioral insights into tax administration to enhance voluntary compliance, reduce evasion, and improve revenue collection.

b. The intervention and its theoretical basis

Various psychological factors contribute to the challenges of tax compliance among individuals. A primary issue is the complexity of tax laws, which can discourage taxpayers and reduce their willingness to comply. Individuals often assess their knowledge of tax regulations, impacting their compliance intentions. Additionally, misconceptions about taxation frequently lead to non-compliance. Negative attitudes toward taxation, influenced by cultural, social, and personal beliefs, can also lower compliance rates. Social norms—such as the perception that others evade taxes—can further encourage tax evasion.

When individuals perceive the tax system as unfair, whether regarding tax distribution (who pays what), collection procedures, or penalties, they may be more inclined to evade taxes. It is widely acknowledged that the intrinsic desire to pay taxes, or tax morale, varies among individuals and societies. Low tax morale can result in increased evasion. Furthermore, cognitive shortcuts, or heuristics, such as misperceptions of risk and the effect of framing, can influence decisions about tax compliance. For example, if taxpayers mistakenly believe that audits are rare or penalties are lenient, they may engage in riskier behavior.

Finally, the manner in which tax authorities interact with taxpayers plays a crucial role in compliance. An enforcement-oriented approach (e.g., heavy fines, audits) can provoke resistance, while a service-oriented approach (e.g., facilitation, transparency) can foster trust and promote voluntary compliance (Kirchler, 2007).

In light of the above, let us explore the "slippery slope model," which suggests that tax compliance relies on a balance between trust in authorities and the authorities' power to enforce compliance. When trust is low, the use of enforcement measures may backfire, leading to even greater tax evasion.

 The Slippery Slope Framework (SSF) focuses on the relationship between trust in tax authorities and their power. It distinguishes between voluntary compliance, based on trust, and enforced compliance, based on authority. Trust in tax authorities is fostered through transparency, fairness, and effective tax administration. High levels of trust encourage voluntary compliance, with taxpayers willingly paying taxes as a contribution to society. Strong institutions, equitable tax policies, and public confidence in the government are likely to yield higher levels of voluntary compliance.

 Power, on the other hand, refers to the ability of tax authorities to observe, audit, and penalize tax evaders. When power is high, it leads to enforced compliance, where taxpayers comply out of fear of being caught and punished. Relying too heavily on enforcement can create resentment and ultimately undermine voluntary compliance over time. The interaction between power and trust should be mutually reinforcing. Optimal tax compliance is achieved through a balance of both factors. When trust is high, enforcement is minimal, fostering a cooperative environment among taxpayers. Conversely, when trust is low, tax authorities must increase enforcement, creating an adversarial atmosphere that encourages resistance. A slippery slope scenario arises when both trust and power are low, resulting in widespread tax evasion. 

Slippery Slope Framework
Figure 4: Pictorial representation of Slippery Slope Framework, Source: https://www.mdpi.com/

Research shows that trust in tax institutions significantly affects overall tax compliance more than enforcement measures do. While enforced compliance can be effective, it risks damaging long-term trust and voluntary compliance. Therefore, policy approaches should aim to build trust by treating taxpayers fairly while also maintaining an effective enforcement system(Lisi & University of Cassino, 2019). 

Slippery Slope Matrix
Figure 5: Slippery Slope Framework Matrix

c. Details of its implementation

It is evident from the discussion supra that more trust in tax authorities coupled with fair enforcement will yield more compliance. The implementation must combine behavioral insights to increase voluntary tax compliance, transcending the classical enforcement paradigm. Some of the most important behavioral-based recommendations are highlighted below:

1. Social Sanctions & Recognition – Publicizing payment of taxes or rewarding compliant taxpayers affects behavior by social norms. When people notice others paying taxes, they tend to comply themselves. Some countries have implemented "honor lists" for high taxpayers, thus generating positive reinforcement, while others apply mild social sanctions for non-compliance(Dom et al., 2022). In India, regular high-income taxpayers are awarded while middle-income taxpayers are not recognised. All layers of taxpayers must be rewarded, including free-lounge facilities in airports, free insurance coverages, priority access in airports, preferred seat allocation in railways, reduced toll rates, etc. 

2. Trust-Based Compliance – Taxpayers are more compliant when they feel the tax system is equitable, fair, and accountable. Governments must show transparency in tax collection and expenditure to create trust, decrease corruption perceptions and enhance voluntary compliance(Dom et al., 2022). Strengthening anti-corruption institutions, speedy trials in corrupt cases, barring corrupt politicians from contesting elections, breaking the bureaucratic-politico nexus through transparency and increasing accountability through public audits, etc.

3. Simplified Tax Processes – If tax procedures are too complicated, taxpayers are likely to hide taxes because they are confused, or compliance is costly. Simplification of tax reporting processes, making digital platforms available, and the availability of unambiguous tax policy promote compliance through minimizing the compliance effort(Dom et al., 2022). The tax department has continuously taken steps to simplify the tax filing process, including E-filing, compliance through online, simplified tax forms, etc. The recent simplification of provisions in the Income Tax Act is an example. Still, a lot can be done to make it less complex. Simplification of TDS provisions and processes, relief from mandatory tax audits in the thriving sectors such as MSME, renewable energy, prompt refunds, etc.

4. Behaviorally Designed Letters – Research indicates that tailored tax reminders with behavioral nudges, for example, highlighting social norms ("9 out of 10 individuals pay their taxes on time"), applying loss aversion (alerting taxpayers to possible penalties), or making moral appeals, strongly enhance tax compliance(Das Biswas, 2024).  We should make tax filers feel privileged and of a high moral status worthy of publishing to all. 

5. Pre-filled Tax Returns – Compliance rises when the process is simple. Pre-populating tax returns using third-party information minimizes errors, saves time, and enhances taxpayer trust, resulting in greater compliance(Das Biswas, 2024). The use of AI and data analytics could help pre-populate the relevant data for tax filing, where a taxpayer has to just give his consent or otherwise. This requires substantial investment in building infrastructure for the integration of bank transaction details, movable and immovable property details, and other relevant information to get it populated. 

6. Public Goods Communication—Governments can enhance tax morale by connecting tax payments with observable public goods, like infrastructure and healthcare. This reinforces the perception that taxes directly fund citizens' welfare (Dom et al., 2022). Visibility of how tax money is used will have a huge impact on taxpayers' morale. 


Figure 6: Strategic communication to nudge the common people to contribute to building the nation.  
When supplemented by conventional deterrence mechanisms, these behavioural interventions provide a more efficient and trust-based tax system.

d. The final/expected results

Behavioral considerations, such as psychological and social influences, are important for enhancing tax compliance rather than mere enforcement. The Slippery Slope Framework (SSF) postulates that tax compliance is affected by two key variables: trust in tax agencies and perceived enforcement authority. By using behavioral nudges that raise trust levels and tax morale, governments can move compliance from enforcement-based to voluntary, which is more sustainable in the long term.

One crucial method is ensuring transparency and equity in tax administration, as this fosters trust and encourages voluntary compliance. When taxpayers perceive tax policies as fair and believe the government acts responsibly, they are more inclined to comply willingly. Additionally, social norms and peer influence can serve as powerful motivators; research shows that informing individuals about high compliance rates among their peers significantly increases the likelihood of tax payment.

Another effective nudge involves positive reinforcement. Studies suggest that recognising and rewarding cooperative taxpayers—whether through acknowledgment or modest incentives—promotes positive behavior and strengthens tax morale. Conversely, relying solely on deterrent measures such as audits and penalties may yield temporary compliance but can undermine long-term trust and foster a confrontational dynamic of "cops vs. robbers."

By thoughtfully implementing behavioral nudges such as personalized messaging, simplifying tax preparation, and fostering trust, governments can cultivate a synergistic tax environment where high compliance can be achieved even in the absence of strong enforcement. Ultimately, voluntary compliance is far more effective and sustainable in the long run than compelled compliance. Through these initiatives, tax buoyancy will be enhanced, allowing for the necessary resources to support the development sector and other areas.

e. Examples from China

A Chinese field experiment tested deterrence and non-deterrence nudges to tax compliance by reminding 7,377 taxpayers. Deterrence nudges, such as credit penalties and fines for late payment, boosted compliance by more than 6%, whereas non-deterrence nudges, such as appeals to tax morale, had no influence. The effect was transitory—credit fines affected behavior for up to six months, whereas other deterrence nudges decayed more quickly. Private-sector employees, high-income earners, and men were more responsive, while government employees, entrepreneurs, and the super-wealthy displayed minimal change(Yang et al., 2024).

The research highlights that while simple nudges are beneficial, achieving lasting compliance requires both effective enforcement measures and the fostering of trust within the community. These elements are crucial for fostering positive and sustainable behaviours.


Seeding Tomorrow's Tax Base: The Formalisation Argument the Finance Commission Hasn't Made Yet

Direct tax collection in India is heavily concentrated: a small number of states account for a large share of receipts, while many others co...